


Creation d'un histogramme ideal pour les statistiques [titre modere car bourre de fautes...]
Contenu du snippet
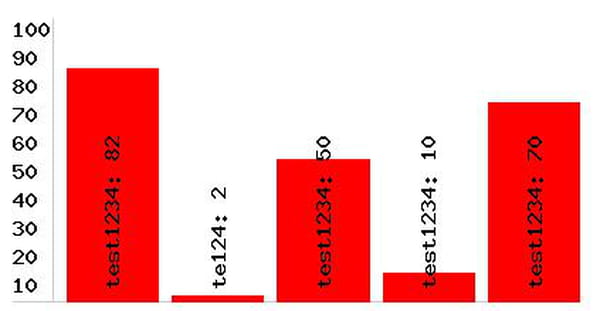
Un jolie histogrammes pour les statistique (parametrable
?id1=nb1&id2=nb2&id3=nb3&id4=nb4&id5=nb5&pid1=nom1&pid2=nom2&pid3=nom3&pid4=nom4&pid5=nom5)
?id1=nb1&id2=nb2&id3=nb3&id4=nb4&id5=nb5&pid1=nom1&pid2=nom2&pid3=nom3&pid4=nom4&pid5=nom5)
Source / Exemple :
<?

if(isset($_GET['id1']) && isset($_GET['id2']) && isset($_GET['id3']) && isset($_GET['id4']) && isset($_GET['id5']) && isset($_GET['pid1']) && isset($_GET['pid2']) && isset($_GET['pid3']) && isset($_GET['pid4']) && isset($_GET['pid5']))
{

    /*
- Histogramme au format GIF
- /
A voir également
- Creation d'un histogramme ideal pour les statistiques [titre modere car bourre de fautes...]
- Keno statistiques - Forum Visual Basic
- Statistiques loto - Forum Visual Basic
- Statistiques - Forum C# / .NET
- Creation gencod - Forum Visual Basic 6
- Création automatique de documents - Forum ASP / ASP.NET
Du même auteur (wizard512)
-
Prechargement d'image(s), avec barre de progression ( différente version ) [ 0% (x)html , 100% js ]
-
Une fonction qui dort ======> sleep( seconde );
-
Ajaxsimplifier en une seul fonction ( get && post )
-
[ sysfastcache v.1 ] systeme de cache, géré par une class
-
Une fonction pour la gestion du clavier et une autre pour l'interdiction de taper une touche non numérique [ ns, ff & ie ]
Vous n'êtes pas encore membre ?
inscrivez-vous, c'est gratuit et ça prend moins d'une minute !
Les membres obtiennent plus de réponses que les utilisateurs anonymes.
Le fait d'être membre vous permet d'avoir un suivi détaillé de vos demandes et codes sources.
Le fait d'être membre vous permet d'avoir des options supplémentaires.