


Chart flash avec vb6
Description
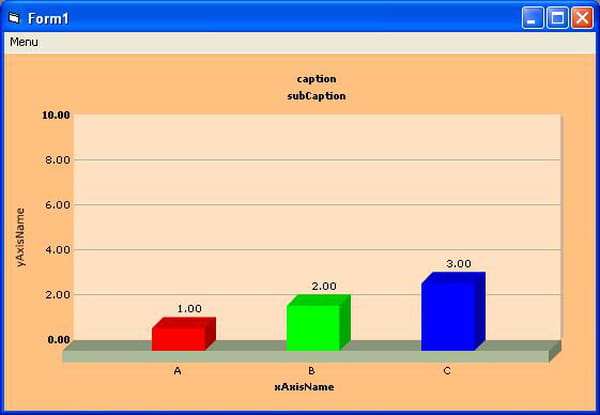
Bonjour, ce code présente une méthode permettant d'utiliser de "beaux" graphiques dans un programme VB6.
Ceci sans excel ni mschart.
J'ai cherché des OCX utilisables en VB6 permettant d'afficher des graphiques et j'ai été déçu.
Soit pas assez beau à mon goût soit, bien évidemment, payants...
En revenche, on peut trouver des "objets" de type flash pour les sites internets.
L'astuce de ce code est de se servir de ces compsants flash en les encapsulants dans un/des Usercontrol(s).
Le code implémenté montre l'emploie d'un column 2D / 3D de chez FusionChart.
Ils fournissent également des courbes / des camemberts et bien d'autres,il suffit de refaire l'encapsulation.
Sans prétention, c'est une méthode comme une autre qui, il me semble, n'a pas encore été exploitée (pas de source sur VBFrance tout du moins)
J'ai trouvé les Flash exploitables (gratuitement) suivants :
- Fusion Chart Free
- Open FLash Chart
- Black Box Chart
- amCharts (très bon)
si vous en connaissez d'autres, merci de me le faire savoir, je les ajouterais a la liste.
Ceci sans excel ni mschart.
J'ai cherché des OCX utilisables en VB6 permettant d'afficher des graphiques et j'ai été déçu.
Soit pas assez beau à mon goût soit, bien évidemment, payants...
En revenche, on peut trouver des "objets" de type flash pour les sites internets.
L'astuce de ce code est de se servir de ces compsants flash en les encapsulants dans un/des Usercontrol(s).
Le code implémenté montre l'emploie d'un column 2D / 3D de chez FusionChart.
Ils fournissent également des courbes / des camemberts et bien d'autres,il suffit de refaire l'encapsulation.
Source / Exemple :
Option Explicit
' codé par Florentcreate pour la communauté VBFrance
' permet d'utiliser dans un programme VB6 des graphiques flash
' implémenté pour un graphique BAR COLUMN n séries
' nécéssite Microsoft VB Scripting Runtime

Private Const Cst_Movie = "Charts\FCF_" & "Column"

Public Enum E_D_MODE
    chart_2D = 2
    chart_3D = 3
End Enum
Private p_mode As E_D_MODE

'VB6 apelle un "programme" Flash qui charge le graphique a partir d'un fichier Xml
Private p_Xml_Generated As Boolean  'si le Xml a été généré
Private p_Xml_Add As String         'adresse à laquelle créer le fichier Xml

'les valeurs du graph
    Private p_val_x As String
    Private p_val_y As String
    Private p_val_color As String

'Generic Properties
    Private p_shownames As Boolean           '"1/0" : This attribute can have either of the two possible values: 1,0. It sets the configuration whether the x-axis values (for the data sets) will be displayed or not. By default, this attribute assumes the value 1, which means that the x-axis names will be displayed.
    Private p_showValues As Boolean          '"1/0" : This attribute can have either of the two possible values: 1,0. It sets the configuration whether the data numerical values will be displayed along with the columns, bars, lines and the pies. By default, this attribute assumes the value 1, which means that the values will be displayed.
    Private p_showLimits As Boolean          '"1/0" : Option whether to show/hide the chart limit textboxes.
    Private p_rotateNames As Boolean         '"1/0" : Configuration that sets whether the category name text boxes would be rotated or not.
    Private p_animation As Boolean           '"1/0" : This attribute sets whether the animation is to be played or whether the entire chart would be rendered at one go.
    Private p_showColumnShadow As Boolean    '"1/0": Whether the 2D shadow for the columns would be shown or not.
'Background Properties
    Private p_bgColor As OLE_COLOR  '"HexColorCode" : This attribute sets the background color for the chart. You can set any hex color code as the value of this attribute. Remember that you DO NOT need to assign a "#" at the beginning of the hex color code. In fact, whenever you need to provide any hex color code in FusionCharts XML data document, you do not have to assign the # at the beginning.
    Private p_bgAlpha As Byte       '"NumericalValue(0-100)" : This attribute helps you set the alpha (transparency) of the graph. This is particularly useful when you need to load the chart in one of your Flash movies or when you want to set a background image (.swf) for the chart.
    Private p_bgSWF As String       'Path of SWF File" : This attribute helps you load an external .swf file as a background for the chart.
'Canvas Properties
    Private p_canvasBgColor As OLE_COLOR        '"HexColorCode" : This attribute helps you set the background color of the canvas.
    Private p_canvasBgAlpha As Byte             '"NumericalValue(0-100)" : This attribute helps you set the alpha (transparency) of the canvas.
    Private p_canvasBorderColor As OLE_COLOR    '"HexColorCode" : This attribute helps you set the border color of the canvas.
    Private p_canvasBorderThickness As Byte     '"NumericalValue(0-100)" : This attribute helps you set the border thickness (in pixels) of the canvas.
'Chart and Axis Titles
    Private p_caption As String        '"String" : This attribute determines the caption of the chart that would appear at the top of the chart.
    Private p_subCaption As String     '"String" : Sub-caption of the chart
    Private p_xAxisName As String      '"String" : x-Axis text title (if the chart supports axis)
    Private p_yAxisName As String      '"String" : y-Axis text title (if the chart supports axis)
'Chart Numerical Limits
    Private p_yAxisMinValue As Double '"value": This attribute determines the lower limit of y-axis.
    Private p_yAxisMaxValue As Double '"value" : This attribute determines the upper limit of y-axis.
'#####################################################
Public Property Get Xml_Add() As String
    Xml_Add = p_Xml_Add
End Property
Public Property Let Xml_Add(value As String)
    If (p_Xml_Add <> value) Then
        p_Xml_Add = value
        p_Xml_Generated = False
        Call Graph_draw: PropertyChanged "xml_add"
    End If
End Property
'#####################################################

'#####################################################
'#####################################################
Private Sub UserControl_Initialize()
    p_Xml_Generated = False
    p_Xml_Add = App.Path & "\Data.xml"

    p_val_x = ""
    p_val_y = ""
    p_val_color = ""
End Sub
Private Sub UserControl_Resize()
    SWF.Top = 0
    SWF.Left = 0
    SWF.Width = ScaleWidth
    SWF.Height = ScaleHeight

    Graph_draw
End Sub
Private Sub UserControl_ReadProperties(PB As PropertyBag)
    p_Xml_Add = PB.ReadProperty("xml_add", App.Path & "\Data.xml")

    p_shownames = PB.ReadProperty("shownames", False)
    p_showValues = PB.ReadProperty("showValues", False)
    p_showLimits = PB.ReadProperty("showLimits", False)
    p_rotateNames = PB.ReadProperty("rotateNames", False)
    p_animation = PB.ReadProperty("animation", False)
    p_showColumnShadow = PB.ReadProperty("showColumnShadow", False)

    p_bgColor = PB.ReadProperty("bgColor", vbWhite)
    p_bgAlpha = PB.ReadProperty("bgAlpha", 100)
    p_bgSWF = PB.ReadProperty("bgSWF", "")

    p_val_x = PB.ReadProperty("val_x", "")
    p_val_y = PB.ReadProperty("val_y", "")
    p_val_color = PB.ReadProperty("val_color", "")

    p_mode = PB.ReadProperty("mode", chart_2D)

    p_canvasBgColor = PB.ReadProperty("canvasBgColor", vbWhite)
    p_canvasBgAlpha = PB.ReadProperty("canvasBgAlpha", 100)
    p_canvasBorderColor = PB.ReadProperty("canvasBorderColor", vbBlack)
    p_canvasBorderThickness = PB.ReadProperty("canvasBorderThickness", 1)

    p_caption = PB.ReadProperty("caption", "caption")
    p_subCaption = PB.ReadProperty("subCaption", "subCaption")
    p_xAxisName = PB.ReadProperty("xAxisName", "xAxisName")
    p_yAxisName = PB.ReadProperty("yAxisName", "yAxisName")

    p_yAxisMinValue = PB.ReadProperty("yAxisMinValue", Empty)
    p_yAxisMaxValue = PB.ReadProperty("yAxisMaxValue", Empty)

    p_Xml_Generated = False
    Graph_draw
End Sub
Private Sub UserControl_WriteProperties(PB As PropertyBag)
    PB.WriteProperty "xml_add", p_Xml_Add, App.Path & "\Data.xml"

    PB.WriteProperty "shownames", p_shownames
    PB.WriteProperty "showValues", p_showValues
    PB.WriteProperty "showLimits", p_showLimits
    PB.WriteProperty "rotateNames", p_rotateNames
    PB.WriteProperty "animation", p_animation
    PB.WriteProperty "showColumnShadow", p_showColumnShadow

    PB.WriteProperty "bgColor", p_bgColor
    PB.WriteProperty "bgAlpha", p_bgAlpha
    PB.WriteProperty "bgSWF", p_bgSWF


    PB.WriteProperty "mode", p_mode


    PB.WriteProperty "canvasBgColor", p_canvasBgColor
    PB.WriteProperty "canvasBgAlpha", p_canvasBgAlpha
    PB.WriteProperty "canvasBorderColor", p_canvasBorderColor
    PB.WriteProperty "canvasBorderThickness", p_canvasBorderThickness

    PB.WriteProperty "caption", p_caption
    PB.WriteProperty "subCaption", p_subCaption
    PB.WriteProperty "xAxisName", p_xAxisName
    PB.WriteProperty "yAxisName", p_yAxisName

    PB.WriteProperty "yAxisMinValue", p_yAxisMinValue, Null
    PB.WriteProperty "yAxisMaxValue", p_yAxisMaxValue, Null

    PB.WriteProperty "val_x", p_val_x
    PB.WriteProperty "val_y", p_val_y
    PB.WriteProperty "val_color", p_val_color

'PB.WriteProperty "", p_
End Sub
'#####################################################
'#####################################################

Private Sub Gen_XML()
    'Ouverture du fichier
    Dim File As New Scripting.FileSystemObject
    Dim Stream As Scripting.TextStream
    Set Stream = File.OpenTextFile(p_Xml_Add, ForWriting, True)
    '-------------------------------------------------------------

        Stream.Write "<!-- Fichier généré automatiquement -->" & vbCrLf  'commentaire

        'balise de début de graphique
            Stream.Write "<graph " & vbCrLf

        'proprietes génériques
            If p_shownames Then
                Stream.Write vbTab & "shownames='1' " & vbCrLf
            Else
                Stream.Write vbTab & "shownames='0' " & vbCrLf
            End If
            If p_showValues Then
                Stream.Write vbTab & "showValues='1' " & vbCrLf
            Else
                Stream.Write vbTab & "showValues='0' " & vbCrLf
            End If
            If p_showLimits Then
                Stream.Write vbTab & "showLimits='1' " & vbCrLf
            Else
                Stream.Write vbTab & "showLimits='0' " & vbCrLf
            End If
            If p_rotateNames Then
                Stream.Write vbTab & "rotateNames='1' " & vbCrLf
            Else
                Stream.Write vbTab & "rotateNames='0' " & vbCrLf
            End If
            If p_animation Then
                Stream.Write vbTab & "animation='1' " & vbCrLf
            Else
                Stream.Write vbTab & "animation='0' " & vbCrLf
            End If
            If p_showColumnShadow Then
                Stream.Write vbTab & "showColumnShadow='1' " & vbCrLf
            Else
                Stream.Write vbTab & "showColumnShadow='0' " & vbCrLf
            End If

            Stream.Write vbTab & "bgColor='" & OLEC_to_RGB(p_bgColor) & "' " & vbCrLf
            Stream.Write vbTab & "bgAlpha='" & p_bgAlpha & "' " & vbCrLf
            Stream.Write vbTab & "bgSWF='" & p_bgSWF & "' " & vbCrLf

            Stream.Write vbTab & "canvasBgColor='" & OLEC_to_RGB(p_canvasBgColor) & "' " & vbCrLf
            Stream.Write vbTab & "canvasBorderColor='" & OLEC_to_RGB(p_canvasBorderColor) & "' " & vbCrLf
            Stream.Write vbTab & "canvasBgAlpha='" & p_canvasBorderColor & "' " & vbCrLf
            Stream.Write vbTab & "canvasBorderThickness='" & p_canvasBorderThickness & "' " & vbCrLf

            Stream.Write vbTab & "caption='" & p_caption & "' " & vbCrLf
            Stream.Write vbTab & "subcaption='" & p_subCaption & "' " & vbCrLf
            Stream.Write vbTab & "xAxisName='" & p_xAxisName & "' " & vbCrLf
            Stream.Write vbTab & "yAxisName='" & p_yAxisName & "' " & vbCrLf

            If (Not IsEmpty(yAxisMinValue)) Then
                Stream.Write vbTab & "yAxisMinValue='" & p_yAxisMinValue & "' " & vbCrLf
            End If
            If (Not IsEmpty(yAxisMaxValue)) Then
                Stream.Write vbTab & "yAxisMaxValue='" & p_yAxisMaxValue & "' " & vbCrLf
            End If

            Stream.Write ">" & vbCrLf

        'ecriture des valeurs
        Dim t_x() As String: t_x = Split(p_val_x, " ")
        Dim t_y() As String: t_y = Split(p_val_y, " ")
        Dim t_color() As String: t_color = Split(p_val_color, " ")
        Dim i As Integer
        For i = 0 To UBound(t_x)
            Stream.Write vbTab & "<set name='" & t_x(i) & "'" & _
                         "value='" & t_y(i) & "'" & _
                         "color='" & t_color(i) & "'/>" & vbCrLf
        Next

        'balise de fin de graph
        Stream.Write "</graph>" & vbCrLf

    'fermeture du fichier
    Stream.Close
    '-------------------------------------------------------------

    p_Xml_Generated = True
End Sub

Public Sub Graph_draw()
    If Not p_Xml_Generated Then
        Gen_XML
    End If

    SWF.FlashVars = "dataURL=" & p_Xml_Add & _
                    "&chartWidth=" & SWF.Width & _
                    "&chartHeight=" & SWF.Height

    SWF.LoadMovie 0, App.Path & "\" & Cst_Movie & p_mode & "D" & ".swf"

    SWF.Rewind
End Sub

'####################################################
Public Property Get mode() As E_D_MODE
    mode = p_mode
End Property
Public Property Let mode(v As E_D_MODE)
    If (p_mode <> v) Then
        p_mode = v
        p_Xml_Generated = False

        Call Graph_draw: PropertyChanged "mode"
    End If
End Property
'####################################################

'####################################################
Public Property Get shownames() As Boolean
    shownames = p_shownames
End Property
Public Property Let shownames(v As Boolean)
    If (p_shownames <> v) Then
        p_shownames = v
        p_Xml_Generated = False

        Call Graph_draw: PropertyChanged "shownames"
    End If
End Property
'####################################################
Public Property Get showValues() As Boolean
    showValues = p_showValues
End Property
Public Property Let showValues(v As Boolean)
    If (p_showValues <> v) Then
        p_showValues = v
        p_Xml_Generated = False

        Call Graph_draw: PropertyChanged "showValues"
    End If
End Property
'####################################################
Public Property Get showLimits() As Boolean
    showLimits = p_showLimits
End Property
Public Property Let showLimits(v As Boolean)
    If (p_showLimits <> v) Then
        p_showLimits = v
        p_Xml_Generated = False

        Call Graph_draw: PropertyChanged "showLimits"
    End If
End Property
'####################################################
Public Property Get rotateNames() As Boolean
    rotateNames = p_rotateNames
End Property
Public Property Let rotateNames(v As Boolean)
    If (p_rotateNames <> v) Then
        p_rotateNames = v
        p_Xml_Generated = False

        Call Graph_draw: PropertyChanged "rotateNames"
    End If
End Property
'####################################################
Public Property Get animation() As Boolean
    animation = p_animation
End Property
Public Property Let animation(v As Boolean)
    If (p_animation <> v) Then
        p_animation = v
        p_Xml_Generated = False

        Call Graph_draw: PropertyChanged "animation"
    End If
End Property
'####################################################
Public Property Get showColumnShadow() As Boolean
    showColumnShadow = p_showColumnShadow
End Property
Public Property Let showColumnShadow(v As Boolean)
    If (p_showColumnShadow <> v) Then
        p_showColumnShadow = v
        p_Xml_Generated = False

        Call Graph_draw: PropertyChanged "showColumnShadow"
    End If
End Property
'####################################################

'####################################################
Public Property Get bgColor() As OLE_COLOR
    bgColor = p_bgColor
End Property
Public Property Let bgColor(v As OLE_COLOR)
    If (p_bgColor <> v) Then
        p_bgColor = v
        p_Xml_Generated = False

        Call Graph_draw: PropertyChanged "bgColor"
    End If
End Property
'####################################################
Public Property Get bgAlpha() As Byte
    bgAlpha = p_bgAlpha
End Property
Public Property Let bgAlpha(v As Byte)
    If (v > 100) Then v = 100
    If (p_bgAlpha <> v) Then
        p_bgAlpha = v
        p_Xml_Generated = False

        Call Graph_draw: PropertyChanged "bgAlpha"
    End If
End Property
'####################################################
Public Property Get bgSWF() As String
    bgSWF = p_bgSWF
End Property
Public Property Let bgSWF(v As String)
    If (p_bgSWF <> v) Then
        p_bgSWF = v
        p_Xml_Generated = False

        Call Graph_draw: PropertyChanged "bgSWF"
    End If
End Property
'####################################################    PB.WriteProperty "bgColor", p_bgColor

'####################################################
Public Property Get Val_X() As String
    Val_X = p_val_x
End Property
Public Property Let Val_X(v As String)
    If (p_val_x <> v) Then
        p_val_x = v
        p_Xml_Generated = False

        Call Graph_draw: PropertyChanged "val_x"
    End If
End Property
'####################################################
Public Property Get Val_Y() As String
    Val_Y = p_val_y
End Property
Public Property Let Val_Y(v As String)
    If (p_val_y <> v) Then
        p_val_y = v
        p_Xml_Generated = False

        Call Graph_draw: PropertyChanged "val_y"
    End If
End Property
'####################################################
Public Property Get Val_Color() As String
    Val_Color = p_val_color
End Property
Public Property Let Val_Color(v As String)
    If (p_val_color <> v) Then
        p_val_color = v
        p_Xml_Generated = False

        Call Graph_draw: PropertyChanged "val_color"
    End If
End Property
'####################################################

'####################################################
Public Property Get canvasBgColor() As OLE_COLOR
    canvasBgColor = p_canvasBgColor
End Property
Public Property Let canvasBgColor(v As OLE_COLOR)
    If (p_canvasBgColor <> v) Then
        p_canvasBgColor = v
        p_Xml_Generated = False

        Call Graph_draw: PropertyChanged "canvasBgColor"
    End If
End Property
'####################################################
Public Property Get canvasBorderColor() As OLE_COLOR
    canvasBorderColor = p_canvasBorderColor
End Property
Public Property Let canvasBorderColor(v As OLE_COLOR)
    If (p_canvasBorderColor <> v) Then
        p_canvasBorderColor = v
        p_Xml_Generated = False

        Call Graph_draw: PropertyChanged "canvasBorderColor"
    End If
End Property
'####################################################
Public Property Get canvasBgAlpha() As Byte
    canvasBgAlpha = p_canvasBgAlpha
End Property
Public Property Let canvasBgAlpha(v As Byte)
    If (v > 100) Then v = 100
    If (p_canvasBgAlpha <> v) Then
        p_canvasBgAlpha = v
        p_Xml_Generated = False

        Call Graph_draw: PropertyChanged "canvasBgAlpha"
    End If
End Property
'####################################################
Public Property Get canvasBorderThickness() As Byte
    canvasBorderThickness = p_canvasBorderThickness
End Property
Public Property Let canvasBorderThickness(v As Byte)
    If (v > 100) Then v = 100
    If (p_canvasBorderThickness <> v) Then
        p_canvasBorderThickness = v
        p_Xml_Generated = False

        Call Graph_draw: PropertyChanged "canvasBorderThickness"
    End If
End Property
'####################################################

'####################################################
Public Property Get caption() As String
    caption = p_caption
End Property
Public Property Let caption(v As String)
    If (p_caption <> v) Then
        p_caption = v
        p_Xml_Generated = False

        Call Graph_draw: PropertyChanged "caption"
    End If
End Property
'####################################################
Public Property Get subCaption() As String
    subCaption = p_subCaption
End Property
Public Property Let subCaption(v As String)
    If (p_subCaption <> v) Then
        p_subCaption = v
        p_Xml_Generated = False

        Call Graph_draw: PropertyChanged "subcaption"
    End If
End Property
'####################################################
Public Property Get xAxisName() As String
    xAxisName = p_xAxisName
End Property
Public Property Let xAxisName(v As String)
    If (p_xAxisName <> v) Then
        p_xAxisName = v
        p_Xml_Generated = False

        Call Graph_draw: PropertyChanged "xAxisName"
    End If
End Property
'####################################################
Public Property Get yAxisName() As String
    yAxisName = p_yAxisName
End Property
Public Property Let yAxisName(v As String)
    If (p_yAxisName <> v) Then
        p_yAxisName = v
        p_Xml_Generated = False

        Call Graph_draw: PropertyChanged "yAxisName"
    End If
End Property
'####################################################

'####################################################
Public Property Get yAxisMinValue() As Double
    yAxisMinValue = p_yAxisMinValue
End Property
Public Property Let yAxisMinValue(v As Double)
    If (p_yAxisMinValue <> v) Then
        p_yAxisMinValue = v
        p_Xml_Generated = False

        Call Graph_draw: PropertyChanged "yAxisMinValue"
    End If
End Property
'####################################################
Public Property Get yAxisMaxValue() As Double
    yAxisMaxValue = p_yAxisMaxValue
End Property
Public Property Let yAxisMaxValue(v As Double)
    If (p_yAxisMaxValue <> v) Then
        p_yAxisMaxValue = v
        p_Xml_Generated = False

        Call Graph_draw: PropertyChanged "yAxisMaxValue"
    End If
End Property
'####################################################

Private Function OLEC_to_RGB(v As OLE_COLOR) As String
    OLEC_to_RGB = Hex(v)
    OLEC_to_RGB = String(6 - Len(OLEC_to_RGB), "0") & OLEC_to_RGB

    OLEC_to_RGB = Mid(OLEC_to_RGB, 5, 2) & _
                  Mid(OLEC_to_RGB, 3, 2) & _
                  Mid(OLEC_to_RGB, 1, 2)
End Function
Conclusion :
Sans prétention, c'est une méthode comme une autre qui, il me semble, n'a pas encore été exploitée (pas de source sur VBFrance tout du moins)
J'ai trouvé les Flash exploitables (gratuitement) suivants :
- Fusion Chart Free
- Open FLash Chart
- Black Box Chart
- amCharts (très bon)
si vous en connaissez d'autres, merci de me le faire savoir, je les ajouterais a la liste.
Codes Sources
A voir également
- Chart flash avec vb6
- Flàsh scores - Forum Flash
- Riasec flash - Forum Flash
- Symbole flash clavier - Forum Flash
- Flash 8 touche de clavier ✓ - Forum Flash
- Score jeux flash ✓ - Forum Flash
Vous n'êtes pas encore membre ?
inscrivez-vous, c'est gratuit et ça prend moins d'une minute !
Les membres obtiennent plus de réponses que les utilisateurs anonymes.
Le fait d'être membre vous permet d'avoir un suivi détaillé de vos demandes et codes sources.
Le fait d'être membre vous permet d'avoir des options supplémentaires.